Computer systems 4 GOLEM (basic examples)
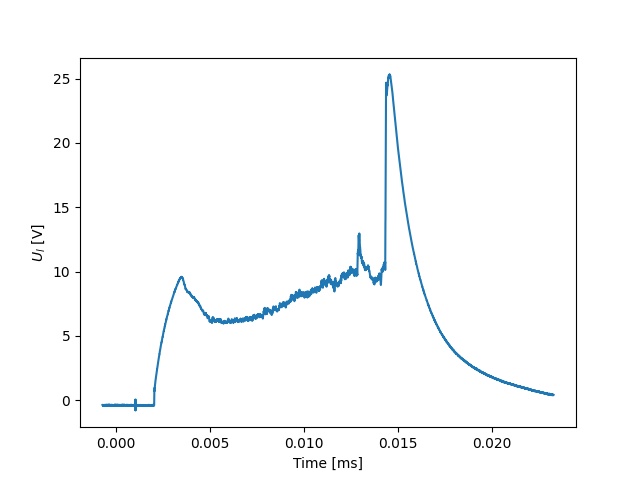
\(U_l\) @ #33993
import numpy as np
import matplotlib.pyplot as plt

shot_no = 37897
identifier = "U_loop.csv"
DAS='Diagnostics/BasicDiagnostics/Results/'
# create data cache in the 'golem_cache' folder
ds = np.DataSource('golem_cache')
#Create a path to data and download and open the file
base_url = "http://golem.fjfi.cvut.cz/shots/"
data_file = ds.open(base_url + str(shot_no)+ '/' +DAS +identifier)
#Load data from the file and plot to screen and to disk
data = np.loadtxt(data_file,delimiter=",")
plt.plot(data[:,0], data[:,1]) #1. column vs 2. column
plt.xlabel('Time [ms]');plt.ylabel('$U_l$ [V]');
plt.savefig('graph.jpg')
plt.show()


#Run it: save it as script.py and run "python script.py" or execute in a ceel in a Jupyter Notebook
|
|
Gnuplot
identifier = 'U_loop.csv' ;
ShotNo = '37897'
# Create a path to the data
DAS='Diagnostics/BasicDiagnostics/Results/'
baseURL='http://golem.fjfi.cvut.cz/shots/'
DataURL= baseURL.ShotNo.'/'.DAS.identifier
set datafile separator ',';
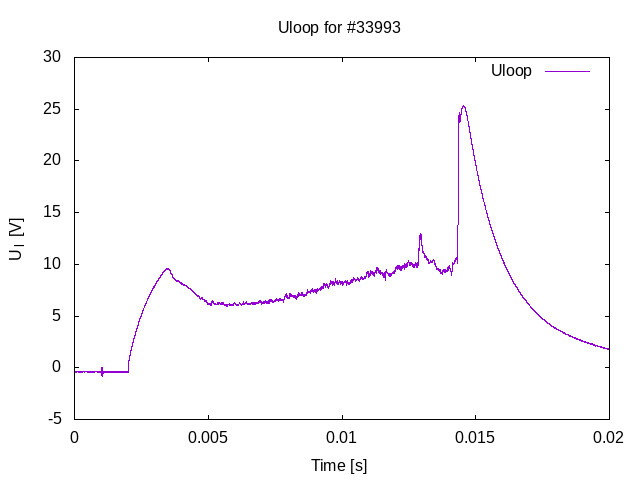
set title "Uloop for #".ShotNo;
# Write data from GOLEM erver to a local file
! wget -q @DataURL ;
# Plot the graph from a local file
set xrange [0:20];set xlabel 'Time [s]';set ylabel 'U_l [V]'
plot identifier u 1:2 w l t 'Uloop'
#Run it interactively or save it as script.gp and run "gnuplot --persist script.gp"
|
|
Command line exectution:
shot_no=37897;ylabel='U_l [V]';signal_id=Diagnostics/BasicDiagnostics/Results/U_loop.csv;gnuplot -p -e "set title 'Golem #`wget -q -O - http://golem.fjfi.cvut.cz/shots/$shot_no/shot_no`';set datafile separator ',';set xlabel 't [s]';set ylabel '$ylabel';plot '< wget -q -O - http://golem.fjfi.cvut.cz/shots/$shot_no/$signal_id' w l t '$ylabel\@$shot_no'"
Other examples
Matlab
ShotNo=37897
baseURL='http://golem.fjfi.cvut.cz/shots/';
diagnPATH='/Diagnostics/BasicDiagnostics/Results/U_loop.csv';
%Create a path to data
dataURL=strcat(baseURL,int2str(ShotNo),diagnPATH);
% Write data from GOLEM server to a local file
urlwrite(dataURL,'LoopVoltage');
% Load data
data = load('LoopVoltage', '\t');
% Plot and save the graph
figure;
hold on
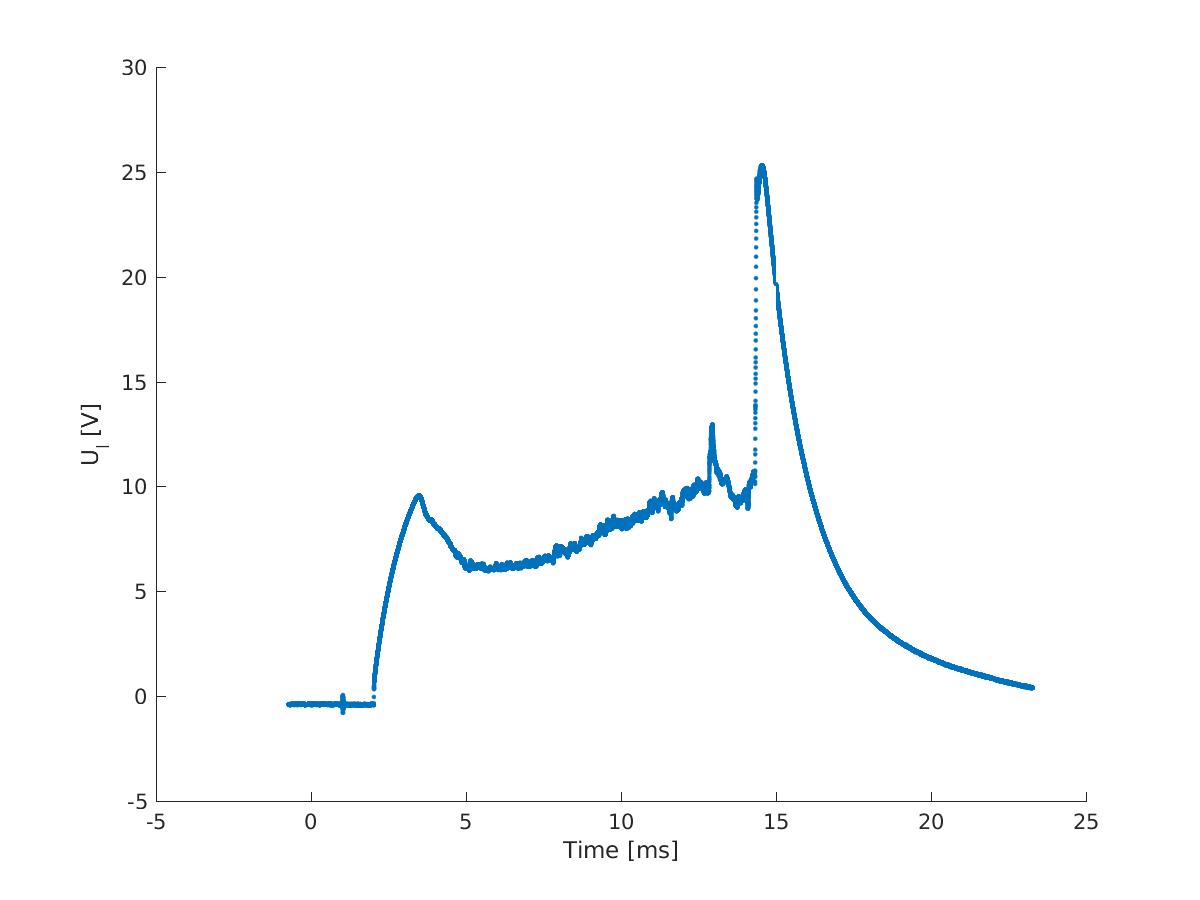
plot(data(:,1), data(:,2), '.') ;
xlabel('Time [ms]')
ylabel('U_l [V]')
hold off
|
|
Octave
ShotNo=37897
baseURL='http://golem.fjfi.cvut.cz/shots/';
diagnPATH='/Diagnostics/BasicDiagnostics/Results/';
%Create a path to data
dataURL=strcat(baseURL,int2str(ShotNo),diagnPATH);
% Write data from GOLEM server to a local file
urlwrite(dataURL,'U_loop.csv');
% Load data
data = load('U_loop.csv', '\t');
% Plot and save the graph
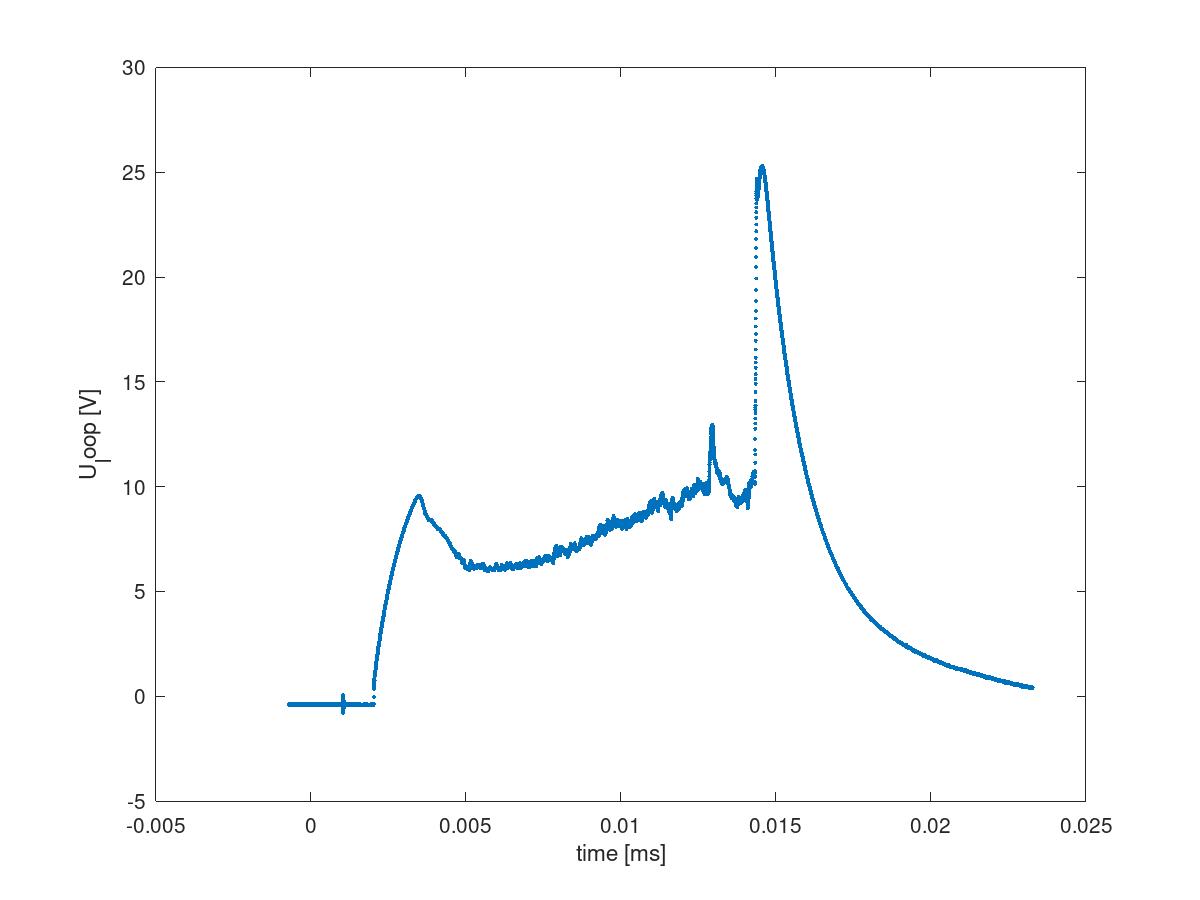
plot(data(:,1), data(:,2), '.') ;
xlabel('time [ms]')
ylabel('U_loop [V]')
saveas(gcf, 'plot', 'jpg');
exit;
|
|