Pygolem toolkit
- FAQ:
- Basic examples / clients for several programming languages
- Use pygolem web interface
- Load data in your page
- Add data from your folder or new DAS to database
- Plot data using includes modules (keep the style)
- Write a python template
- Sign if your page failed or not ( ✓, ✕, ?)
- Integrate your data to pygolem
- Load basic constants / settings
- Advanced examples
- Pygolem files
- TODO
Pygolem is software developed for the tokamak GOLEM database. It provides easy options for loading and saving of data, plotting and advanced data processing. Pygolem is written in Python, however our implementation strongly depends on bash scripts and makefiles.
Use code previews in the GOLEM database for more examples
FAQ:
Basic examples / clients for several programming languages
See more details in DataProcessing section
Try our simple web interface [link] [examples]
Use pygolem web interface
If you need to download data from many shots, the simplest way is to use pygolem web interface. You have to know names of your diagnostics (see the Data page) and you can either use the links provided by the Data page or if you prefer another data formats use following path
http://golem.fjfi.cvut.cz/cgi-bin/data/12345/<your diagn name>_<options>.<format>
supported formats are
| None | Ordinary TAB separated ASCII format |
|---|---|
| .txt | Ordinary TAB separated ASCII format |
| .gz | Zip compressed ordinary TAB separated ASCII format |
| .csv | Comma / semicolon separated ASCII values |
| .npy | Standard python binary data |
| .npz | Compressed python binary data (recommended) |
| .mat | Matlab binary data |
| .xls | Excel 97 format |
| image | Supported formats: png, svg, svgz, pdf |
| .link | return a http link to the stored data |
| .pro | IDL - not supported, use .mat files (load_mat.pro) |
for the ASCII formats you can select if you prefer dots/commas decimal separators
| _dp | Dots point separators, selected as default !! |
|---|---|
| _cp | Comma points separator |
Examples:
http://golem.fjfi.cvut.cz/cgi-bin/data/0/loop_voltage - returns simple ASCII data
http://golem.fjfi.cvut.cz/cgi-bin/data/0/loop_voltage.npz - returns compressed loop voltage data
http://golem.fjfi.cvut.cz/cgi-bin/data/0/loop_voltage.csv- comma separated csv - “czech excel”
http://golem.fjfi.cvut.cz/cgi-bin/data/0/loop_voltage.xls - Excel/OO Calc/Gnumeric
http://golem.fjfi.cvut.cz/cgi-bin/data/0/loop_voltage.png - A simple plot of the data
Load data in your page
use code i.e for loop voltage
from pygolem_lite import Shot
tvec, data  = Shot()['loop_voltage']
and you will download data for shot number where is currently placed your script otherwise use
from pygolem_lite import Shot
from matplotlib.pyplot import *
tvec, data  = Shot(10322)['loop_voltage']
plot(tvec, data)
show()
if you want to download data from DAS “nistandard”:
tvec, data = Shot(10322)['nistandard']if you need only one channel you can use either number or channel id
tvec, data  = Shot(10322)['nistandard', 0]
tvec, data  = Shot(10322)['nistandard', 'uloop']
full list of accessible signal is in golem.fjfi.cvut.cz/shots/0/Data.php
Is is also possible to use wget and pygolem web interface. See more examples in section Advanced examples.
Add data from your folder or new DAS to database
All data settings can be done in
/golem/database/velin/includes/data_configuration.cfg and DAS is in /golem/database/velin/includes/das_configuration.cfg
Use the examples to add new diagnostics. Supported data formats are: npy, npz, None, gz, txt, csv, lvm, you do not need to add the file ending to the config.
Plot data using includes modules (keep the style)
Recommended way: find a page with similar plot and use copy&paste
You can use ie. matplotlib, gnuplot, octave, …
Write a python template
Read manual http://www.makotemplates.org/ , or just copy&paste the code from existing pages - for example DAS or Plasma Position pages
PS: use ## if you want to comment a code outside of code block “<% your code %>”
Sign if your page failed or not ( ✓, ✕, ?)
Write nonzero to status file in your folder if you failed
saveconst('status', 0)  => OK
saveconst('status', 1) => ERROR
saveconst('status', 2) => WORKING
saveconst('status', 3) => UNKNOWN
saveconst('status', 4) => NONE
or if the active code is in the python template
page_path, base_path, page  = get_page_paths(shot, page)
saveconst( page_path + '/status', 0)
Failure - ✕ - is expected as default
Integrate your data to pygolem
If you want to share your results with others, it is recommended to add your results to pygolem.
Add your results to /golem/database/velin/includes/data_configuration.cfg in include directory. You can show accessible data in your .template page with the following code:
Shot(shot).get_pygolem_list(['plasma_position_r', 'plasma_position_z', 'plasma_radius'])Load basic constants / settings
If you need to load basic calibration constants, use:
from pygolem_lite import configThe config from the last shot is available here: config.py
Advanced examples
if you need more options, you can use more functions of the class Data (derived from ndarray):
import matplotlib
matplotlib.rcParams['backend'] = 'Agg'   # plotting on background
matplotlib.rc('font',  size='10')
matplotlib.rc('text', usetex=True)  # latex font
from matplotlib.pyplot import *
from pygolem_lite import Shot
_, data  = Shot(10322)['nistandard']
data = data[::100,0]   # data are downsampled and only the first column is used
errorbar(data.tvec, data, xerr=data.tvec_err, yerr=data.data_err, label=data.labels)  # plot data, use resampled time vector and data
xlabel(data.ax_labels[0])  # use default  labels
ylabel(data.ax_labels[1])
title(data.info)  # use diagnostic / DAS name
savefig( data.name+".png" )   # save using diagn. id
Another example for 2D plotting
from matplotlib.pyplot import *
from pygolem_lite import Shot
data  = Shot(10663)['nistandard'][1]
data = data[::1000,:]   # data are downsampled and only the first column is used
data *= 1000   # data are rescaled
pcolor(data.axis[0], data.axis[1], data.T)
xlabel(data.ax_labels[0])
ylabel(data.ax_labels[1])
title(data.info)  # use diagnostic / DAS name
savefig( data.name+".png" )   # save using diagn. id
for more plotting examples use tutorial
Use of integrated plotting functions
Our framework contains interface for uniform standard plots that can be simply used. Plotting is done using two basic functions get_data and multiplot. The simplest example:
from pygolem_lite.modules import get_data, multiplot
obj = get_data('loop_voltage')
multiplot(obj,  plot_title , file_name , figsize = (9,4) )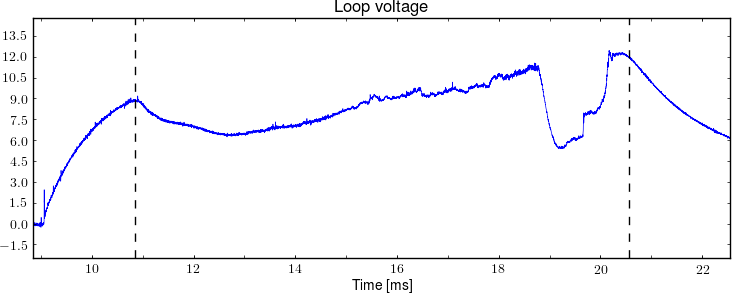
where get_data supports several options how to load data : - input is name from pygolem database ie ‘loop_voltage’, then details are loaded from database - input is path to file in a standard format (ascii matrix or preferably data saved using save_adv - see pygolem.py), note that more additional details should be added to get_data function - - list containing [tvec, data] - Data object
Outputs from get_data can be arranged in list so select order in subplots. For example [obj1, [obj2, obj3]] will create 2 subplots, the first contains obj1, the second obj2+obj3.
from pygolem_lite.modules import get_data, multiplot
data = [[ get_data('electron_temperature', 'Electron temperature', 'T [eV]' , ylim = [0,None] ,  reduction = True),
        get_data('spectrometr\temperature', '$T_e$ spectrometer', 'T [eV]' ,ylim = [0,None],  fmt='r--') ],
       get_data('plasma_current', 'Plasma current', 'I$_{p}$ [kA]' , ylim = [0,None], data_rescale = 1e-3, reduction = True) ]

 multiplot(data, 'Nice graph', 'plot', figsize = (9,5) ,  file_type = 'png')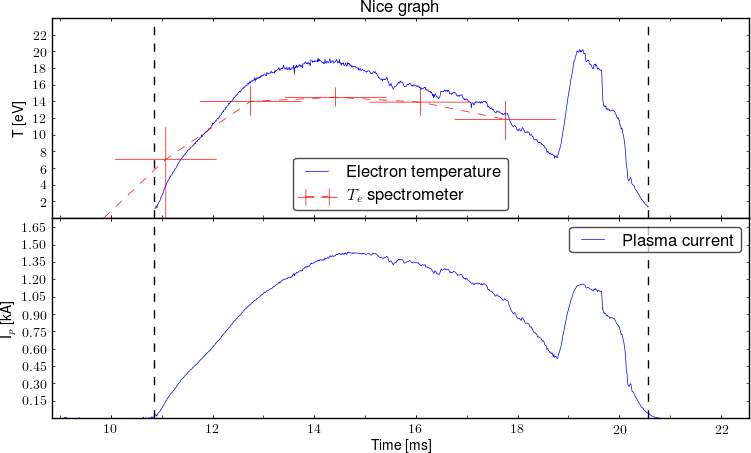
Notes:
- Shot number is auto-detected from current directory
- default image format is png
- default xlabel is “Time [ms]’ => time axis is rescaled to”ms"
Pygolem files
pygolem_lite.py
A basic module, it provides class Shot that can easily load data from the shot database [link] . An example of use:
from pygolem_lite import Shot
tvec, data  = Shot(10322)['loop_voltage']
modules.py
A list of many useful functions that are used in the database [link] . For example: plotting functions, loading config files, code snippets for mako templates.
def get_data(diagn, diagn_name, ylabel = "", xlabel = 'Time [ms]',  xlim = [], ylim = [], \
    tvec_rescale = 1e3, data_rescale = 1,  integrated = False, columns = [], yscale = '', \
    reduction = False, plot_limits = True, smoothing = 0, line_format = "",  \
    vlines = [], annotate = [], xgrid= False, ygrid = False, **kwargs ):
    """
      Load data/diagn and return object that is used for plotting.

      :var str/list/Data class diagn: Input can be string with name of diagn from main database, name of file with locally saved data on disk, list with [tvec,data]
      :var str diagn_name: Name of diagnostics that will be used in legend, if diagn has more signal than name will be `name 0`, `name 1`, ...., or diagn_name can be list with name for each column
      :var str ylabel: Title of ylabel
      :var str xlabel: Title of xlabel
      :var list xlim: Range for X axis, use [1.132 ,None] to define only one limit
      :var list ylim: Range for Y axis, use [1.132 ,None] to define only one limit
      :var double tvec_rescale: Rescale X axis to ms !!  Be careful if the axis is not time in seconds !!
      :var double data_rescale: Rescale Y axis
      :var bool reduction:  Try to reduce number of plotted points, automatically used for integrated signal
      :var bool integrated: Integrate the input signal
      :var list columns: Plot only the selected columns
      :var str yscale: scale of y-axis, use `log`
      :var bool plot_limits: If there is plasma, plot lines at start and end of the plasma
      :var double smoothing: Smooth the signal
      :var str line_format: Standard formating string
      :var bool xgrid: Plot automatic xgrid in the plot
      :var bool ygrid: Plot automatic ygrid in the plot
      :var array xerr: error in X direction
      :var array yerr: error in Y direction
      :var **kwargs : keyword arguments to be passed to the standard plot() command, optional
	    this method accepts **kwargs as a standard :func:`matplotlib.pyplot.plot` function

      Advanced:
      :var list vlines :  list of positions of vertical lines in plot  (see historical analysis)
      :var list annotate: list of dicts  => plt.annotate(annot['text'], annot['pos'], rotation=annot['angle'] )

    """

def multiplot(data_all, title_name, file_name, figsize = (9,7), dpi = 100, orientation = 'vertical', file_type = 'png', reduction = False):
    """ Plot several graphs to on multiplot. Use data `data_all` provided by function get_data !!
	:var dict  data_all:	Input  data or list of input data
	:var str title_name: 	Title of the image
	:var str file_name: 	Name of saved image (without filetype)
	:var list figsize: 	Size of the output image
	:var int  dpi:		DPI of output image
	:var str orientation:	Choose multiplot orientation: vertical/horizontal
	:var str file_type:	Image file type, recomended: png, svgz !! svgz is slow !!
	:var bool reduction:	Decrease number of plotted points => speed up plotting, use for all nice smooth lines !!
    """
config.py
All tokamak constants that should be stable in time are listed in this module [link]
MoinMoin.py
A script that highlight code and generate a HTML from a given file [link]
code2html.py
A newer version of MoinMoin.py with better highlighting. Slightly slower.
utilities.py
Basic shared function library, load config, save config, cat, fix strings, detect None, …
web.py
All shared function for creation of web pages: create image, zoomed image, config, wiki link ,….
data
CGI-like python script [link]. Transparently serve data from the main database to web interface.
An example of use:
http://golem.fjfi.cvut.cz/cgi-bin/data/10322/loop_voltage
golem_data.m
A script for matlab that uses web interface to download data [link]. A simple example of use:
[tvec, data, obj] = golem_data(10011, 'loop_voltage')
plot(tvec, data)
More examples are here
golem_data.py
A script for python that uses web interface to download data [link]. A simple example of use:
from golem_data import golem_data
from matplotlib.pyplot import *
obj = golem_data(10011, 'loop_voltage')
plot(obj1.tvec,obj1.data)
More examples are here